
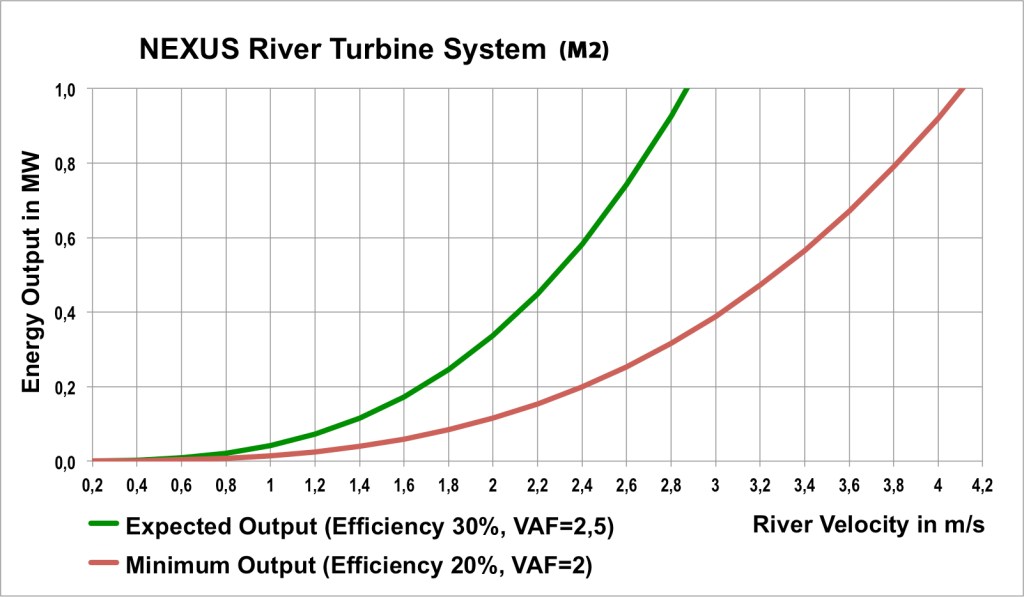
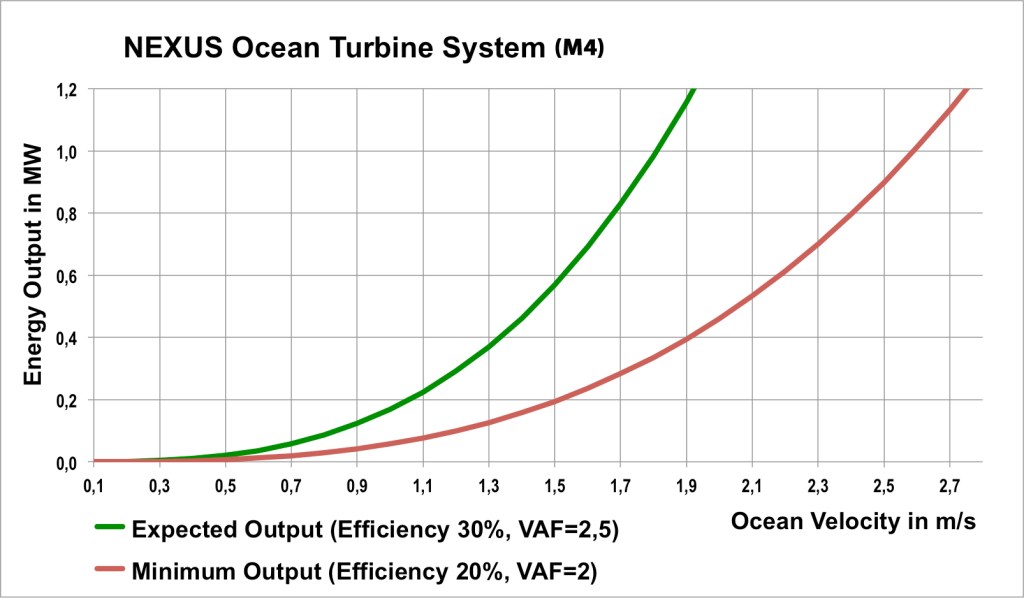
The combined bare turbine and augmentor extract the power used to drive the generator. The following charts show estimates of power generated for two levels of technology maturity:
The red graph forecasts power generated using efficiency achieved in laboratory scale or pilot production tests. The green graph forecasts power generated by means of the system efficiency that we believe to achieve with our applied technology.
Turbine Unit Sizes vary, dependent upon specific use case.
VAF = Velocity Augmentation Factor
Case Studies
Case Study A

You must be logged in to post a comment.